Phosphate homeostasis, monitoring and managment of hyperphosphatemia in patients with the Chronic Kidney diseases
| Site: | ISM-PHD |
| Course: | Clinical Nutrition practice in chronic kidney diseases |
| Book: | Phosphate homeostasis, monitoring and managment of hyperphosphatemia in patients with the Chronic Kidney diseases |
| Printed by: | Guest user |
| Date: | Sunday, 5 July 2026, 3:40 AM |
Description
This section presents material on the significance of hyperphosphatemia in patients with CKD, Dietary Therapy for Managing Hyperphosphatemia
1. Phosphate homeostasis
Phosphate is an abundant mineral found in the body. The body store of phosphate is 500 to 800 g, with 85% of the total body phosphate present in crystals of hydroxyapatite in the bone — about 10% found in muscles and bones in association with proteins, carbohydrates, and lipids. The rest gets distributed in various compounds in the extracellular fluid (ECF) and intracellular fluid (ICF). Phosphate is predominantly an intracellular anion.
The normal plasma inorganic phosphate (Pi ) concentration in an adult is 2.5 to 4.5 mg/dl, and men have a slightly higher concentration than women. In children, the normal range is 4 to 7 mg/dl. A plasma phosphate level higher than 4.5 mg/dL is hyperphosphatemia.
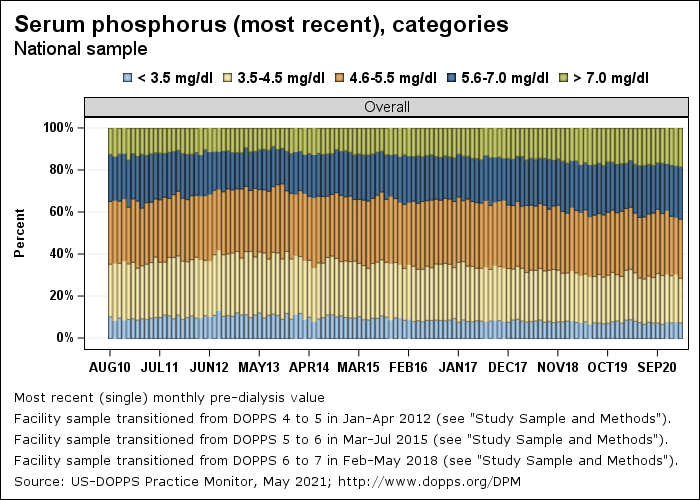
It is possible to achieve normal levels of phosphorus in the blood of patients on dialysis only in 40-50%.
Figure. Serum phosphorus of patients on dialysis (USA)
Phosphate plays an essential role in many biological functions such as the formation of ATP, cyclic AMP, phosphorylation of proteins, etc. Phosphate is also present in nucleic acids and acts as an important intracellular buffer.
Normal adult dietary phosphate intake is around 1000 mg/day. 90% of this is absorbed primarily in the jejunum. In the small intestine, phosphate is absorbed both actively and by passive paracellular diffusion. Active absorption is through sodium-dependent phosphate co-transporter type IIb (NPT2b).
Figure. Transepithelial phosphate transport in the small intestine.
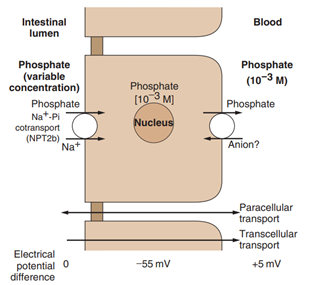
(Phosphate enters the enterocyte (influx) through the brush border
membrane using the Na+
/Pi cotransport system, with a stoichiometry
of 2 : 1, operating against an electrochemical gradient. Phosphate exit
at the basolateral side possibly occurs by passive diffusion or more
probably by anion exchange)
Kidneys excrete ninety percent of the daily phosphate load while the gastrointestinal tract excretes the remainder (Figure).
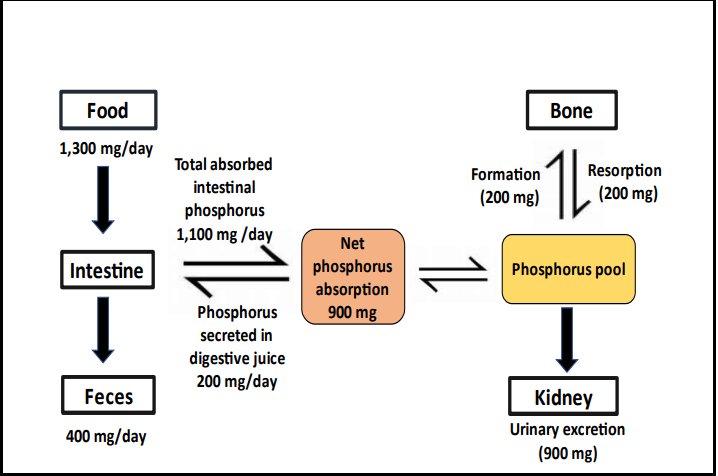
Figure - Phosphorus homeostasis in healthy adults (Dr. David St-Jules., 2022)
As phosphorus is not significantly bound to albumin, most of it
gets filtered at the glomerulus. Therefore, the number of functional nephrons
plays a significant role in phosphorus homeostasis; 75% of filtered phosphorus
is reabsorbed in the proximal tubule, approximately 10% in the distal tubule,
and 15% is lost in the urine. In the luminal side of the proximal tubule, the
primary phosphorus transporter is the Type II Na/Pi co-transporter (NPT-2a).
The activity of this transporter is increased by low serum phosphorus and
1,25(OH)2 vitamin D, increasing reabsorption of phosphorus. Renal tubular
phosphorus reabsorption also increases by volume depletion, chronic
hypocalcemia, metabolic alkalosis, insulin, estrogen, thyroid hormone, and
growth hormone. Tubular reabsorption of phosphorus decreases by
parathyroid hormone, phosphatonins, acidosis, hyperphosphatemia, chronic
hypercalcemia, and volume expansion.
Phosphorus is transported out of the renal cell by a phosphate-anion exchanger located in the basolateral membrane.
Phosphate homeostasis is under direct hormonal influence of calcitriol, PTH, and phosphatonins, including fibroblast growth factor 23 (FGF-23). Receptors for vitamin D, FGF-23, PTH, and calcium-sensing receptor (CaSR) also play an important role in phosphate homeostasis. Serum phosphate level is maintained through a complex interaction between intestinal phosphate absorption, renal phosphate handling, and the transcellular movement of phosphate that occurs between intracellular fluid and bone storage pool. A transient shift of phosphate into the cells is also stimulated by insulin and respiratory alkalosis.
Dr. David St-Jules. A Systematic Review of Online Resources on Dietary Management of Hyperphosphatemia in People with Chronic Kidney Disease (CKD). University of Nevada, Reno. December,2022
2. Sodium-dependent Pi co-transporters
Absorption of phosphate is mediated by the brush border sodium-dependent Pi co-transporters (NPT), which depend on the Na/K-dependent ATPase. There are three classes of these co-transporters.
3. Parathyroid hormone (PTH)
Parathyroid hormone (PTH) is an important hormone that controls calcium and phosphate concentration through stimulation of renal tubular calcium reabsorption and bone resorption. PTH also stimulates the conversion of 25- hydroxyvitamin D to 1,25 dihydroxy vitamin D in renal tubular cells, which promotes intestinal calcium absorption as well as bone turnover.
Parathyroid hormone is synthesized, processed, and stored in parathyroid cells. Parathyroid hormone is secreted by exocytosis within seconds after induction of hypocalcemia. In circulation, parathyroid hormone is rapidly taken up by the liver and kidney, where it is cleaved into active amino- and inactive carboxyl-terminal fragments that are then cleared by the kidney. Intact parathyroid hormone has a plasma half-life of two to four minutes.
Any change in ionized calcium concentration gets sensed by calcium-sensing receptor (CaSR) on the surface of parathyroid cells, Increase in calcium activates these receptors, which inhibit parathyroid hormone secretion and decreases renal tubular reabsorption of calcium through second messengers.
Hypocalcemia, induced by increased phosphate levels, can also produce these effects. However, changes in phosphate concentration should be significant to produce substantial changes in serum calcium. Hyperphosphatemia can also directly stimulate parathyroid hormone synthesis as well as parathyroid cellular proliferation.
Figure. Role of phosphate retention in the pathogenesis of secondary hyperparathyroidism
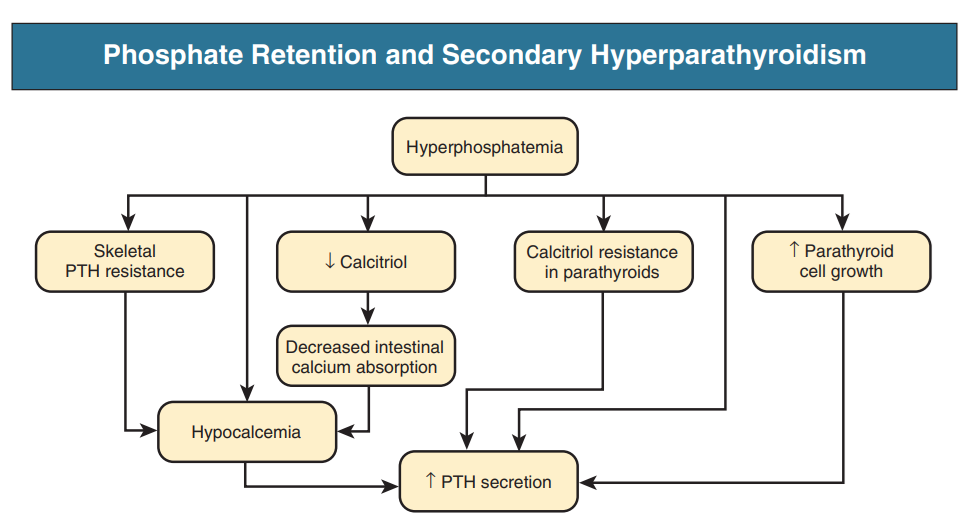
(Hyperphosphatemia stimulates parathyroid hormone (PTH) secretion indirectly by inducing hypocalcemia,
skeletal resistance to PTH, low levels of calcitriol, and calcitriol resistance. Hyperphosphatemia also has
direct effects on the parathyroid gland to increase PTH secretion and parathyroid cell growth. eGFR, Estimated
glomerular filtration rate)
Several drugs, such as penicillin, corticosteroids, some diuretics, furosemide, and thiazides, can induce hyperphosphatemia as an adverse reaction.
4. 1, 25 dihydroxycholecalciferol (1, 25 DHCC)
1, 25 dihydroxycholecalciferol is the activated form of Vitamin D. It increases intestinal phosphate absorption by enhancing the expression of NPT2b transporter and stimulates renal phosphate absorption by increasing expression of NPT2a and NPT2c in the proximal tubule. 1,25 DHCC also enhances FGF23 production. The 1,25(OH)2D also suppresses the synthesis of PTH and enhances FGF23 production.
Figure. Mechanisms contributing to decreased levels of calcitriol in chronic kidney disease
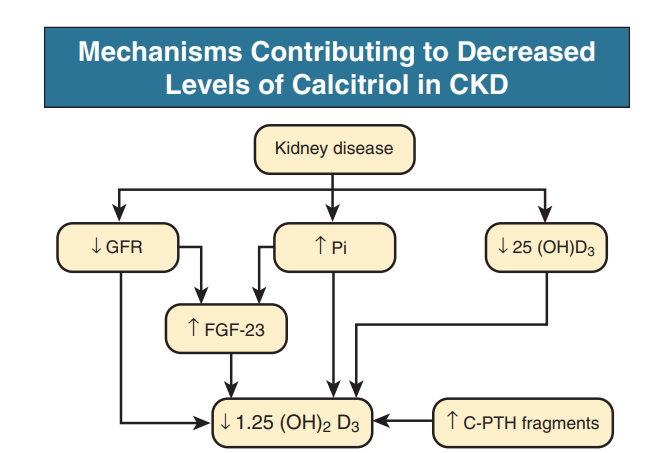
(C-PTH, Carboxyl-terminal parathyroid hormone; FGF-23, fibroblast growth factor-23; GFR, glomerular filtration rate; Pi, inorganic phosphate)
5. Fibroblast growth factor 23 (FGF23)
FGF23 is a phosphatonin that is produced primarily by osteocytes and to a lesser extent, by osteoblasts. It is a hormone that consists of 251 amino acid residues, including a signal peptide comprising 24 amino acids.
It inhibits renal tubular reabsorption of phosphate. FGF23 exerts its effects by binding to the FGFR1-Klotho complex. Alpha Klotho serves as a co-receptor. FGF23 suppresses NPT2a and NPT2c expression at the proximal renal tubules, thereby inhibiting renal phosphate reabsorption.FGF23 also reduces the circulatory level of 1,25(OH)2D by decreasing the expression of 1-alpha-hydroxylase and increasing the expression of 24-hydroxylase.
6. Monitoring
As per KDIGO guidelines, serum phosphate, along with calcium, intact parathyroid hormone (iPTH), and 25-hydroxyvitamin D levels are estimated in all patients with an estimated glomerular filtration rate (eGFR) less than 60 mL/min/1.73 m^2.
If the estimated glomerular filtration rate (eGFR) is between 30 to 59 mL/min/1.73 m^2, serum phosphate, and calcium should be measured every 6 to 12 months. In patients with estimated eGFR 15 to 29 mL/min/1.73 m^2, serum phosphate and calcium require assessment every three to six months
7. Treatment / Management
Dietary interventions, including routine dietary assessment, dietary phosphate restriction, education on reading food labels, and meal preparation with demineralization methods, are core components of hyperphosphatemia management (Figure)
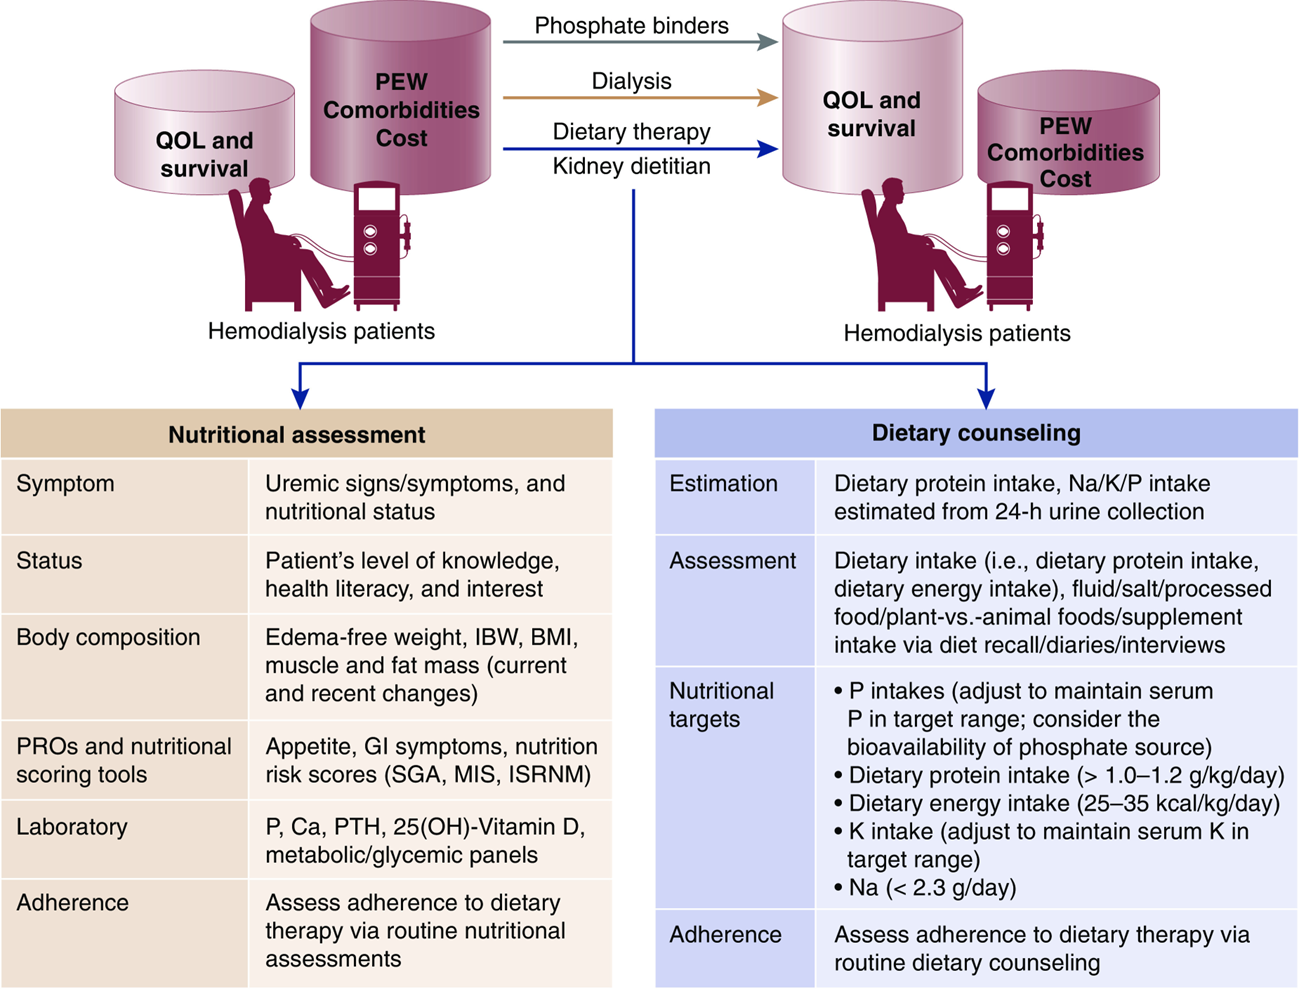
The cornerstones of hyperphosphatemia management in hemodialysis patients include dietary interventions, dialytic removal, and pharmacotherapies. Core components of tailored dietary therapy in hemodialysis patients include routine nutritional assessment and dietary counseling administered by dietitians. BMI, body mass index; Ca, Calcium; GI, gastrointestinal; IBW, ideal body weight; ISRNM, International Society of Renal Nutrition and Metabolism; K, potassium; MIS, malnutrition-inflammation score; Na, sodium; P, phosphate; PTH, parathyroid hormone; PEW, protein energy wasting; PROs, patient-reported outcomes; QOL, quality of life; SGA, subjective global assessment (Narasaki Y).
Acute hyperphosphatemia
If renal function is good, renal phosphate excretion can increase through extracellular volume expansion by saline infusion and diuretics.
7.1. Dietary strategies for limiting phosphorus intake
Choose low phosphorus products and using phosphorus-to-protein ratio <10-12 mg/g
Higher serum phosphate concentrations are associated with mortality, and experimental data suggest that serum phosphate concentration is directly related to bone disease, vascular calcification and cardiovascular disease. Low-phosphorus diets and binders are used to help lower serum phosphate to reduce the long-term complications of CKD-MBD, although more research is needed to fully understand the disease-modifying impact of these interventions
There are actually 3 major sources of phosphates: natural phosphates (as cellular and protein constituents) contained in raw or unprocessed foods, phosphates added to foods during processing, and phosphates in dietary supplements/medications
In adults with CKD 3–5D, it is recommended to adjust dietary phosphorus intake to maintain serum phosphate levels within normal limits. In adults with CKD 1-5D or posttransplantation, it is reasonable when making decisions about phosphorus restriction treatment to consider the bioavailability of phosphorus sources (eg, animal, vegetable, additives). For adults with CKD posttransplantation with hypophosphatemia, it is reasonable to consider prescribing high-phosphorus intake (diet or supplements) in order to replete serum phosphate.
There are physiologic adaptations in the early stages of CKD that prevent excessive phosphorus retention, so the inability to increase phosphorus excretion to avoid phosphorus accumulation and hyperphosphatemia is generally seen when eGFR decreases to <45 mL/min, being less common in earlier CKD stages. In the setting of anuria in patients receiving maintenance dialysis, hyperphosphatemia risks are particularly heightened, with a prevalence as high as 50%. CKD-specific recommendations suggest maintaining phosphorus intake between 800 and 1,000 mg/d in patients with CKD stages 3-5 and those receiving maintenance dialysis to maintain serum phosphate levels in the normal range
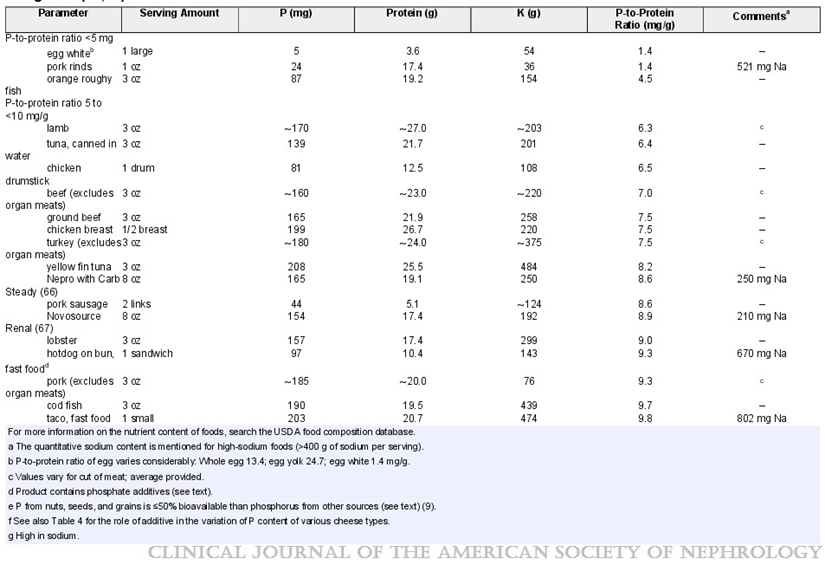
It is recommended to choose natural foods that are low in organic phosphorus over high in protein. The organic phosphorus content per gram of protein varies widely among different foods. Nutrient composition tables, which provide phosphorus to protein ratios, can be used to recommend meal replacement products that can significantly reduce daily organic phosphorus intake while ensuring adequate dietary protein intake
Below are tables with phosphorus content (g/mg) and phosphorus-to protein ratio (mg/g) in various foods and drinks
Table 1- Dietary P, protein, and potassium content of selected food items, ranked according to the P-to-protein ratio categories (Kalantar-Zadeh, Kamyar, 2010)
Substantial amounts of phosphoric acid are usually present in most colas and many other beverages.Many but not all clear-colored soft drinks or teas are low in P;however, most of these drinks contain little to no protein or other organic compounds, and the P is almost exclusively from additives. Being in liquid form, the inorganic P in these drinks are perhaps even more readily absorbable (Table 2).
Table 2- P content of selected beverages, mostly as a result of
additives (based on 12-oz serving) (Kalantar-Zadeh, Kamyar, 2010)
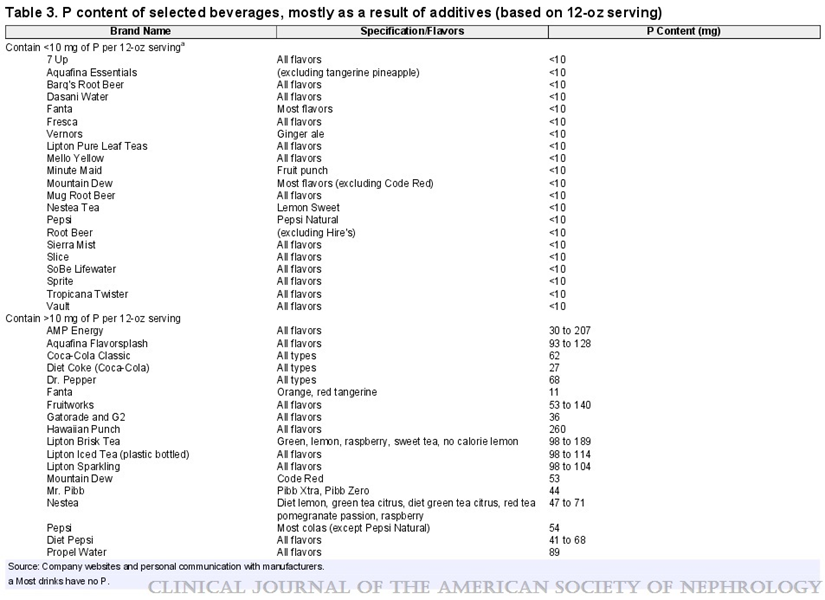
Table 3 illustrates variations in P content across diverse types of cheese in German-speaking regions of Europe. The quantity of P in a 50-g portion of cheese varies from <100 mg in Brie cheese to almost half a gram in processed soft cheese, which contains a significant amount of P salt.
Table 3- Selected types of cheese consumed in German-speaking regions of Europe (Kalantar-Zadeh, Kamyar, 2010)
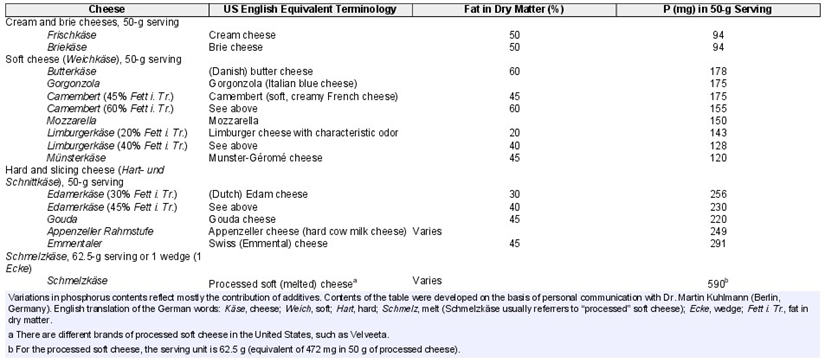
Table 4- Phosphorus/protein ratio per 100g of food (Barril-Cuadrado G, 2013)
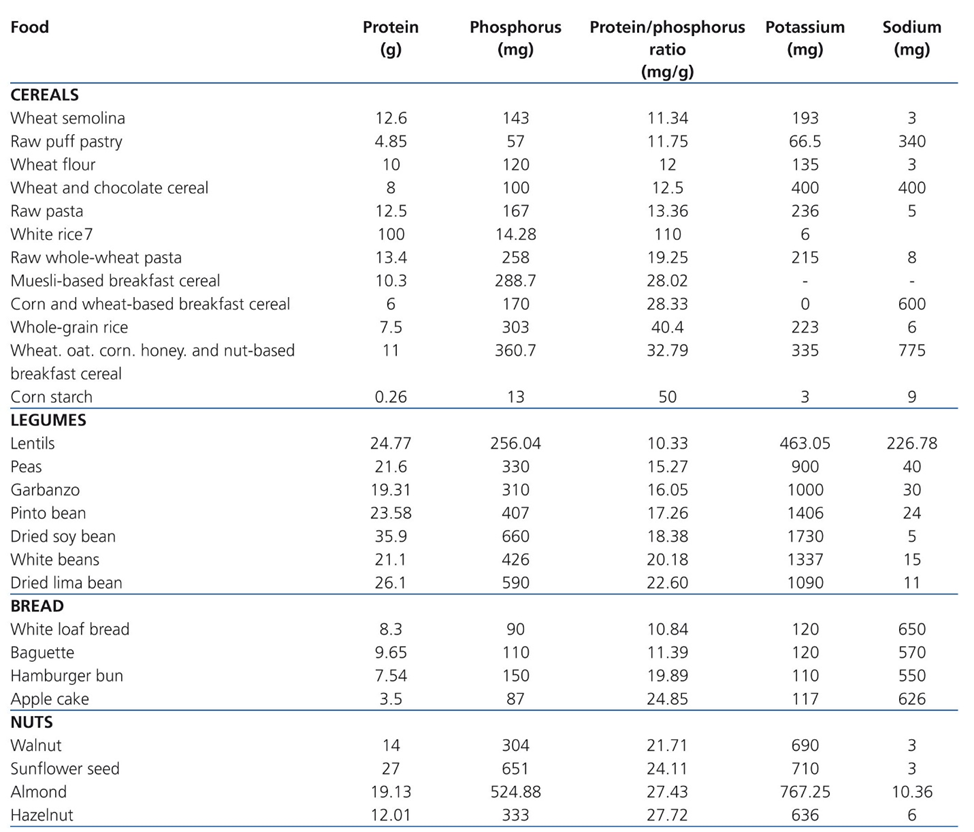
Table 5- Phosphorus and Potassium Content of Commonly Consumed Beverages (Erica Wickham, 2014)
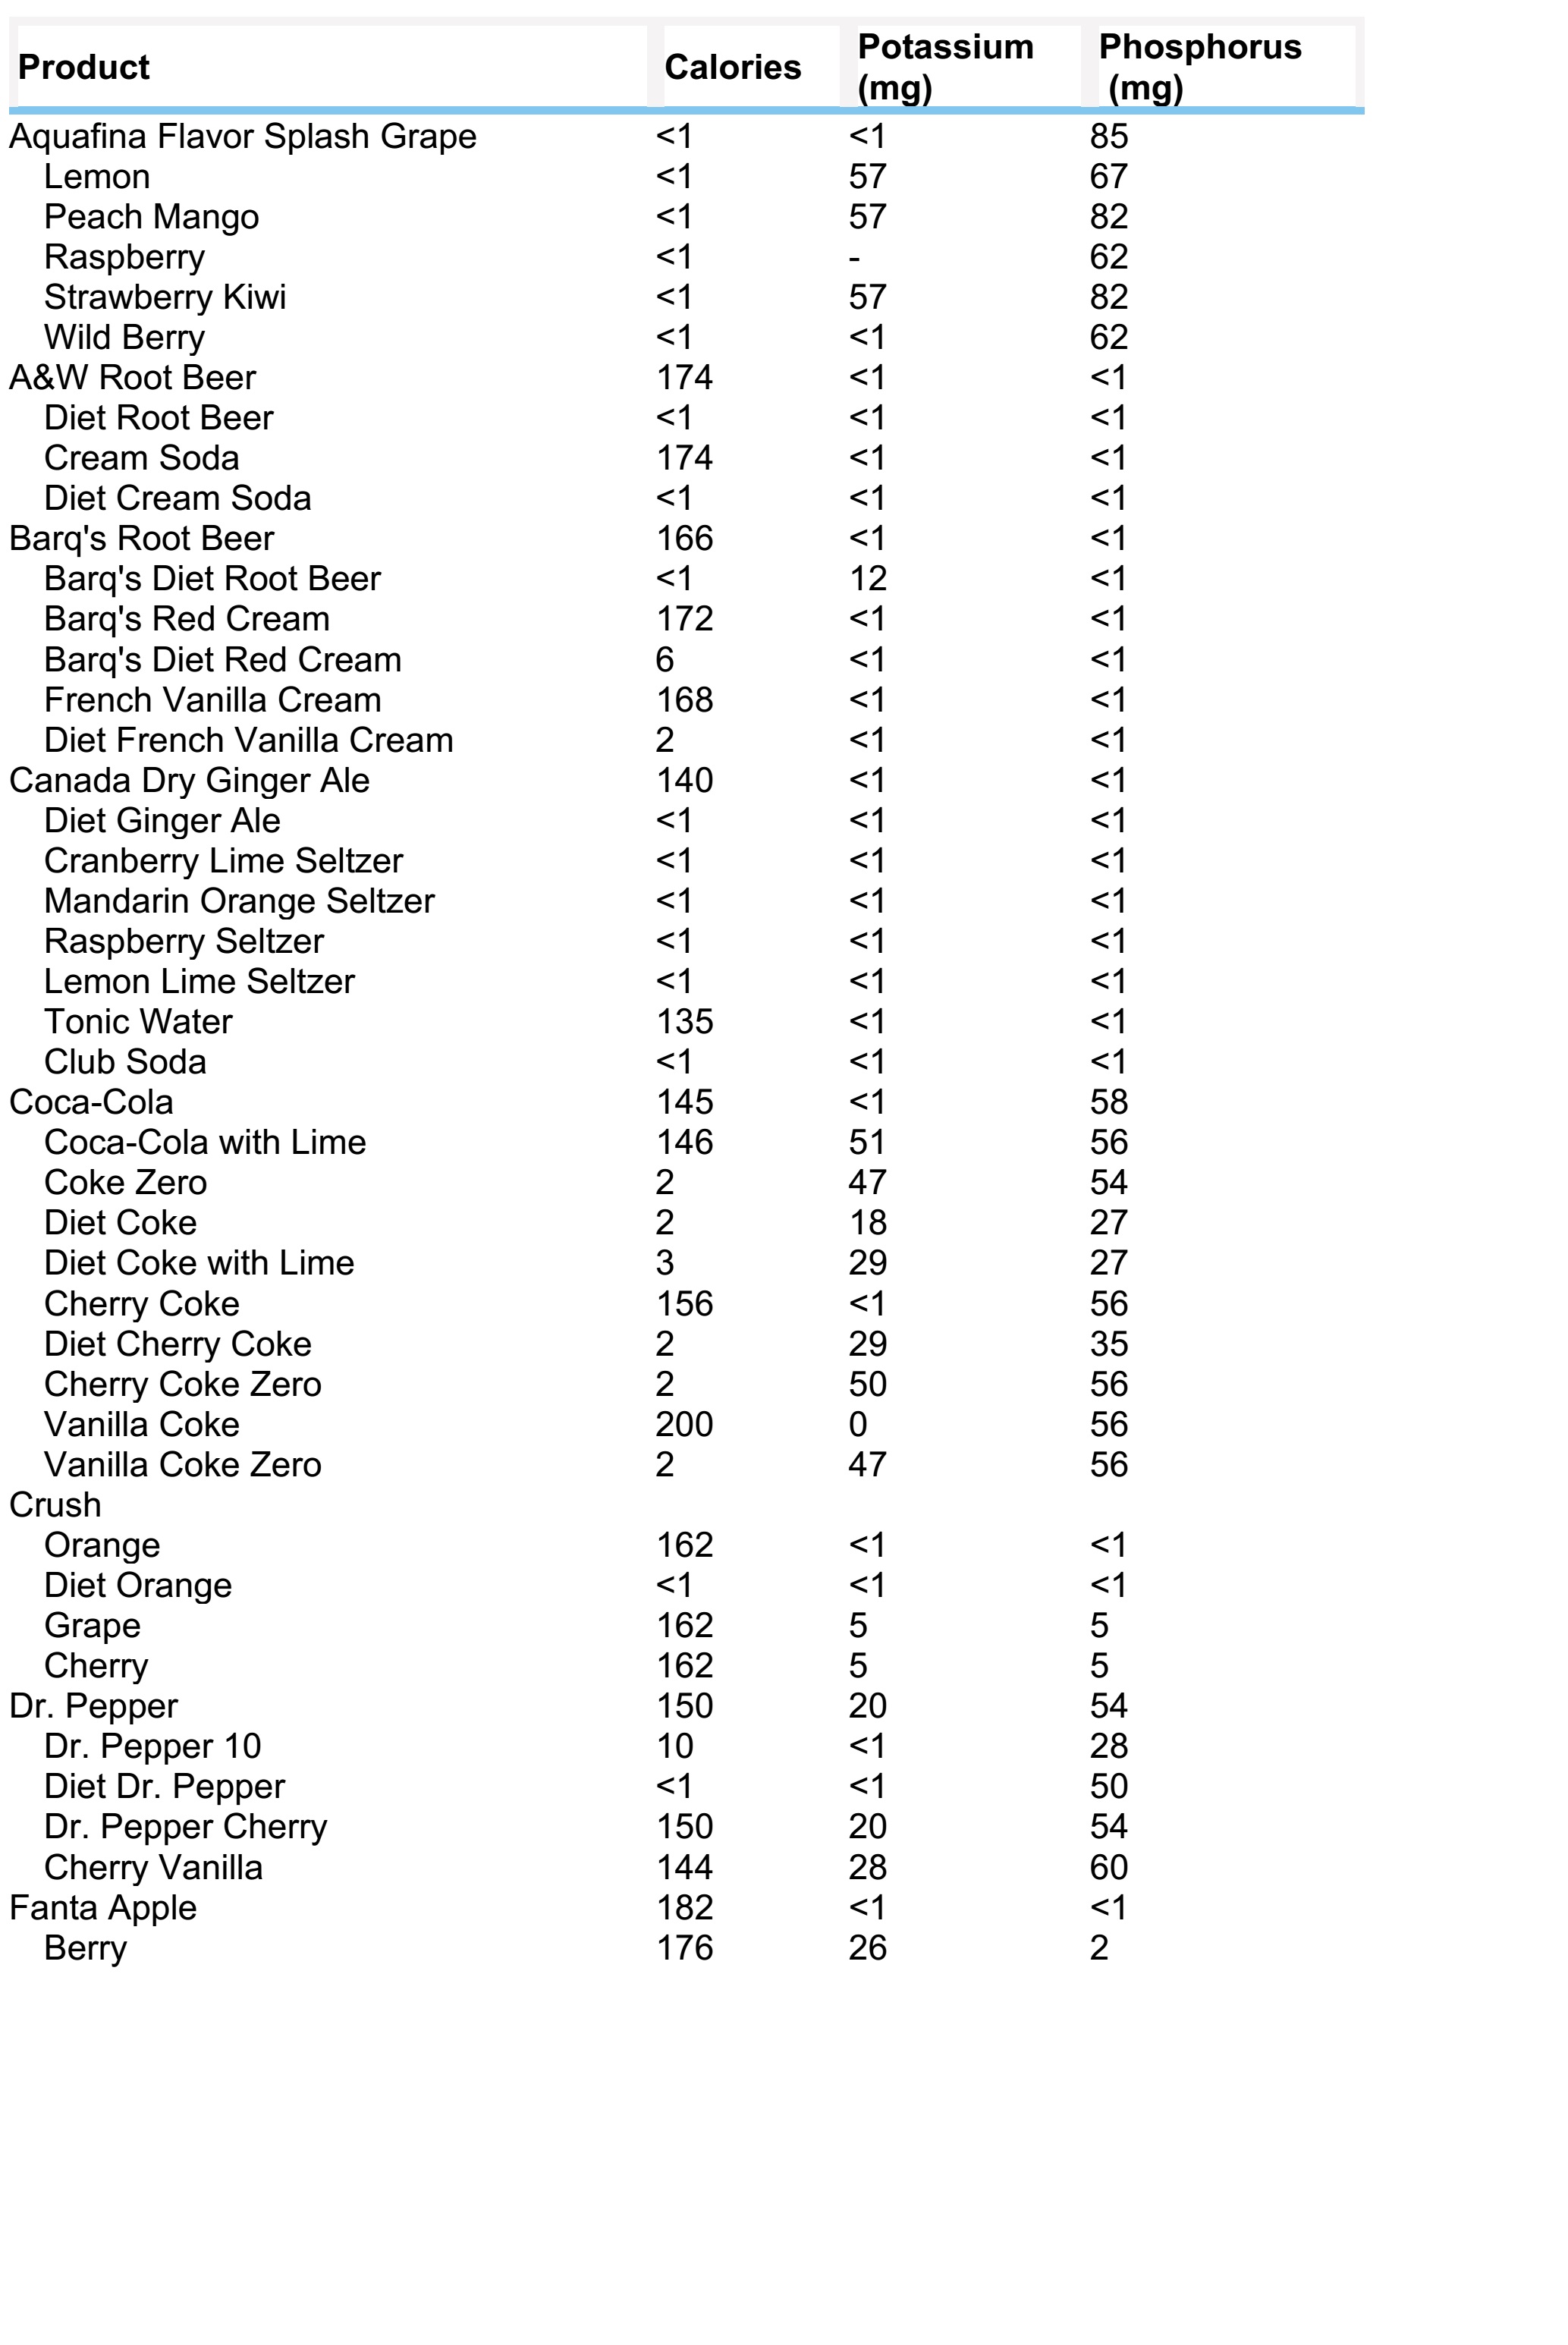
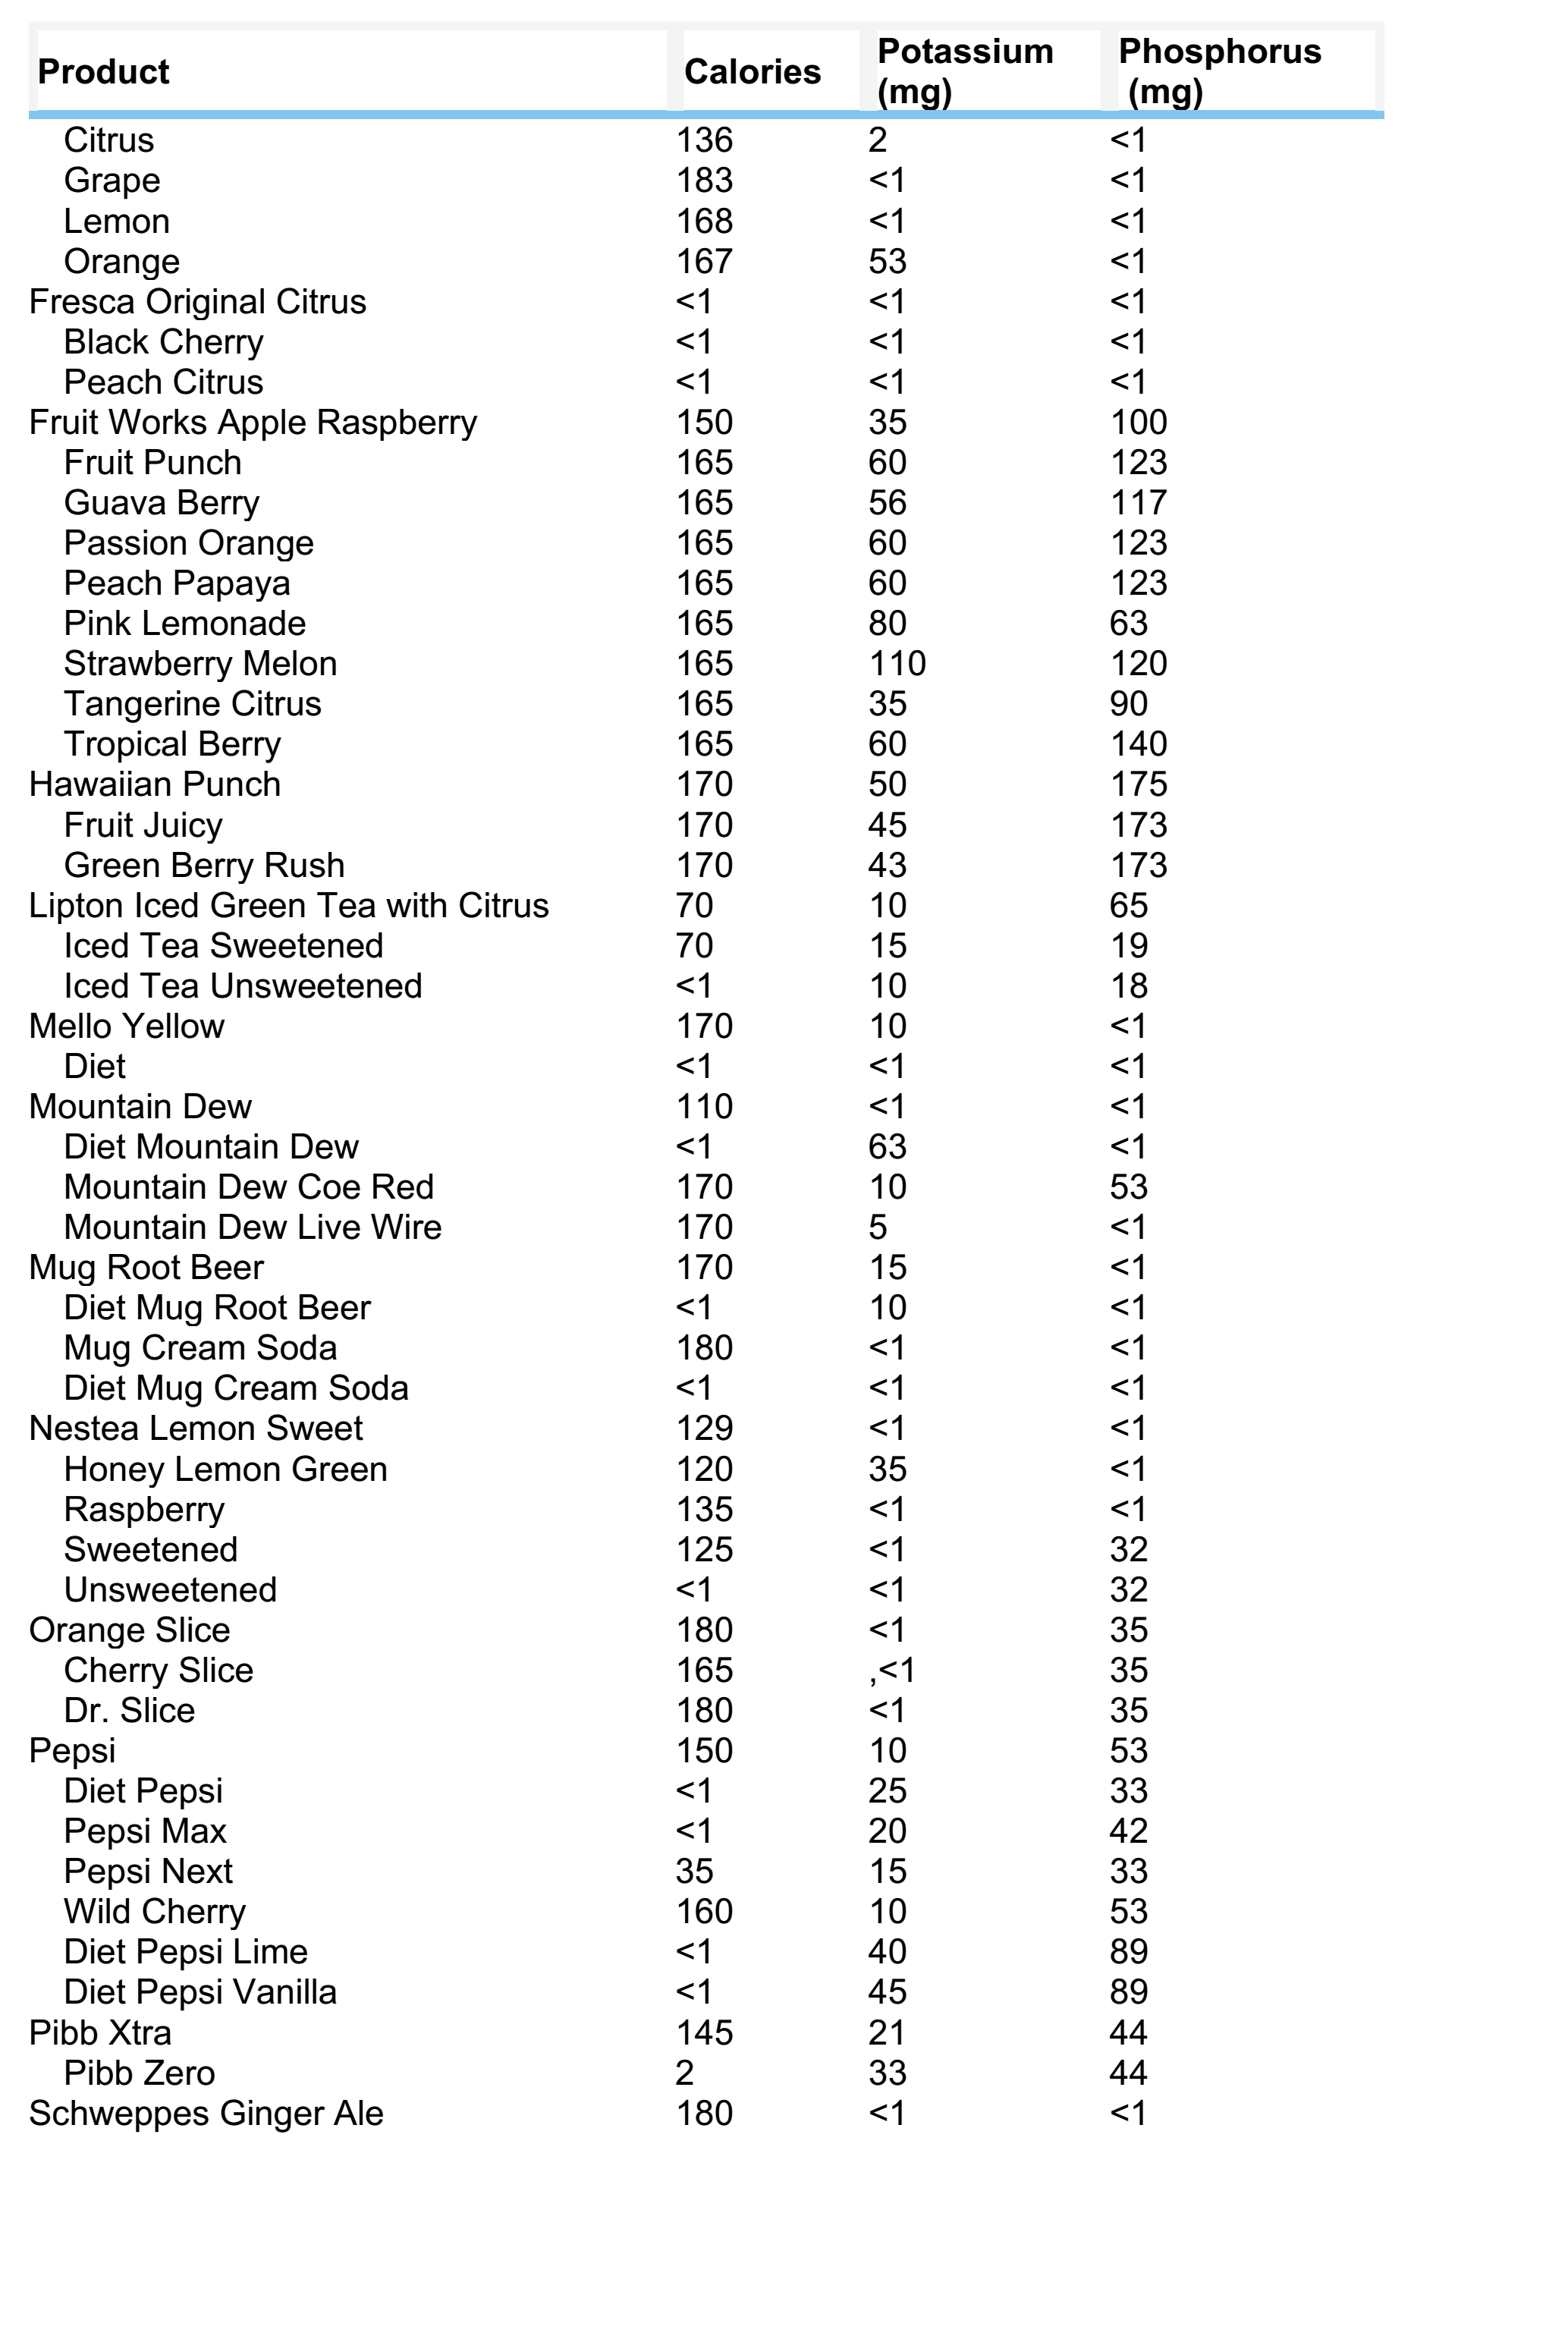
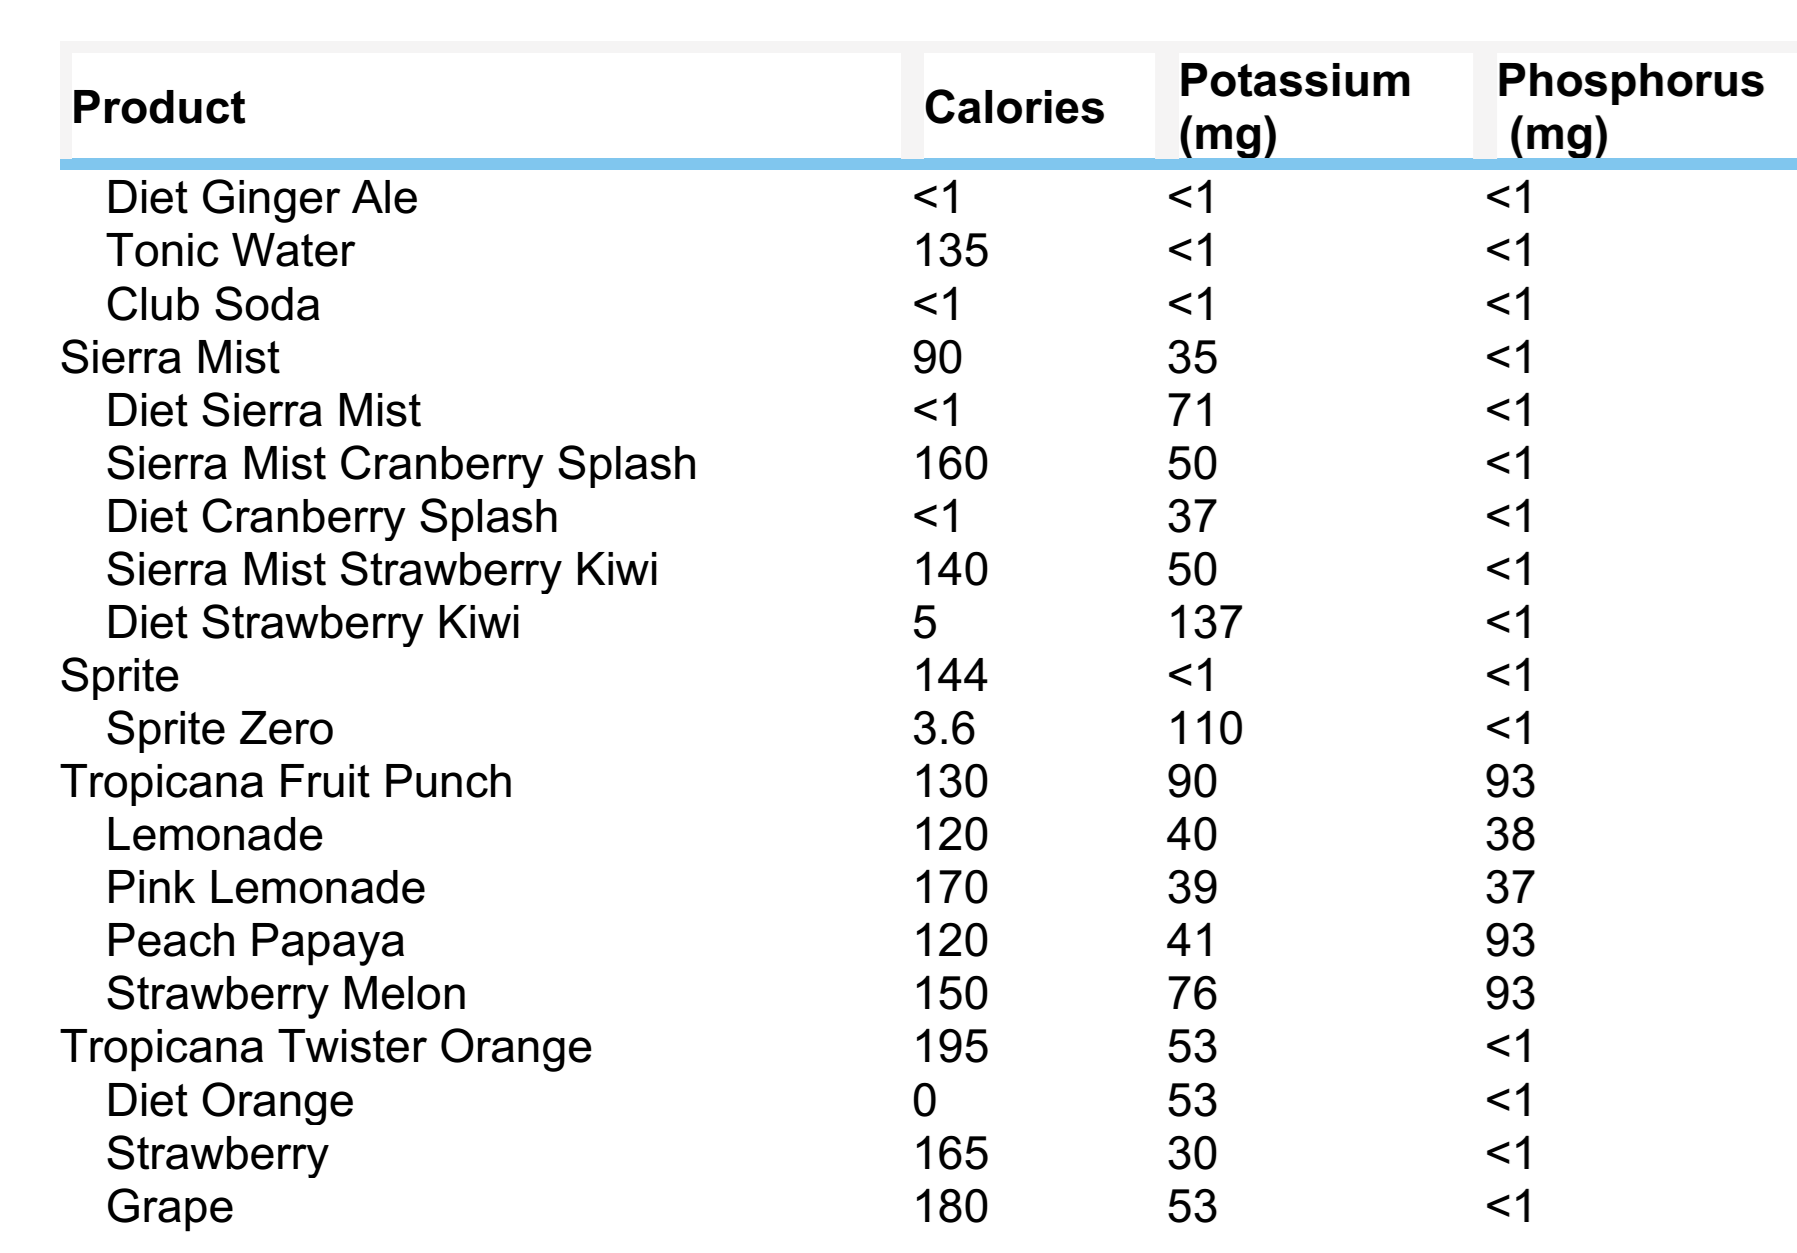
Table 6- Phosphorus Content of Foods According to Food Group (St-Jules DE, 2017)
Food Serving Size Phosphorus (mg)
Per Serving Per 100 kcal Protein foods Chicken breast, roasted, skin removed 3 oz 194 139 Chicken breast, roasted 3 oz 182 109 Chicken breast, fried with batter 3 oz 157 71 Ground beef, 93% lean 3 oz 167 103 Ground beef, 70% lean 3 oz 141 69 Eggs 2 large 197 138 Black beans 1 cup 241 106 Peanut butter, creamy 2 Tbsp 107 56 Sesame seeds 1 oz 181 113 Dairy products Milk, skim 1 cup 247 298 Milk, whole 1 cup 205 138 Yogurt, low-fat, plain 1 cup 353 229 Yogurt, low-fat, vanilla 1 cup 331 159 Cheddar cheese 1.5 oz 193 112 Vanilla ice cream 1 cup 139 51 Grains Bread, white 1 slice 24 36 Bread, whole wheat 1 slice 68 84 Rice, brown 1 cup 208 84 Rice, white 1 cup 68 33 Cereal, Kellogg’s Corn Flakes 1 cup 29 29 Cereal, Kellogg’s All-Bran 1 cup 356 445 Bran muffin 1 medium 425 139 Croissant 1 medium 60 26 Fruits Apples 1 cup 12 21 Applesauce, sweetened 1 cup 18 9 Peaches 1 cup 31 52 Peaches, canned in juice 1 cup 42 38 Peaches, canned in heavy syrup 1 cup 29 15 Vegetables Carrots 1 cup 45 87 Broccoli 1 cup 60 194 Tomatoes 1 cup 43 134 Tomatoes, canned 1 cup 77 100 Tomatoes, canned, stewed 1 cup 51 77 Potatoes 1 medium 123 73 Potatoes, mashed 1 cup 101 43 Potatoes, French fries, McDonald’s 1 medium 149 39
Table 7- PHOSPHORUS-TO-PROTEIN RATIO IN USUAL PORTIONS OF FOOD (Pereira, Raíssa & Ramos, 2020)
Food Amount (g) Usual portion Phosphorus (mg) Protein (g) Ratio phosphorus/protein (mg/g) Meat and eggs Chicken 80 1 medium breast fillet 150 23.0 6.5 Pork 80 1 medium pork chop 147 21.2 6.9 Beef 85 1 medium steak 209 26.0 8.0 Whitefish 84 1 medium fillet 241 20.6 11.7 Beef liver 85 1 medium steak 404 22.7 17.8 Sardine 34 1 unit 170 8.4 20.2 Whole egg 50 1 unit 90 6.0 15 Sausages Sausage* 60 1 unit 126 13.9 9.1 Ham* 48 2 medium slices 136 14 9.7 Milk and dairy products Cheese 30 2 thin slices 153 7.5 20.4 Requeijão * 30 1 tablespoon 134 2.9 46.2 Natural yogurt 120 1 small cup 159 6.3 25.2 UHT milk* 150 1 glass 140 4.9 28.6 Legumes and nuts Cooked beans 154 1 medium ladle 133 6.9 19.3 Peanuts 50 1 small package 253 13 19.5
An
analysis of phosphorus content (mg/100 g edible part) in the various food
groups shows that the highest load comes from nuts, hard cheeses, egg yolk,
meat, poultry and fish. Reporting the phosphorus content as mg per gram of
protein (mg/g protein) is especially useful for identifying which foods supply
less phosphorus with the same amount of protein. Based on the relationship
between phosphorus and proteins, an upper limit of 12 mg/g is recommended to
identify foods with “favorable” phosphorus to protein ratios (10,11).
For clarity of data, a number of countries have developed phosphorus pyramids (D'Alessandro C, 2015).
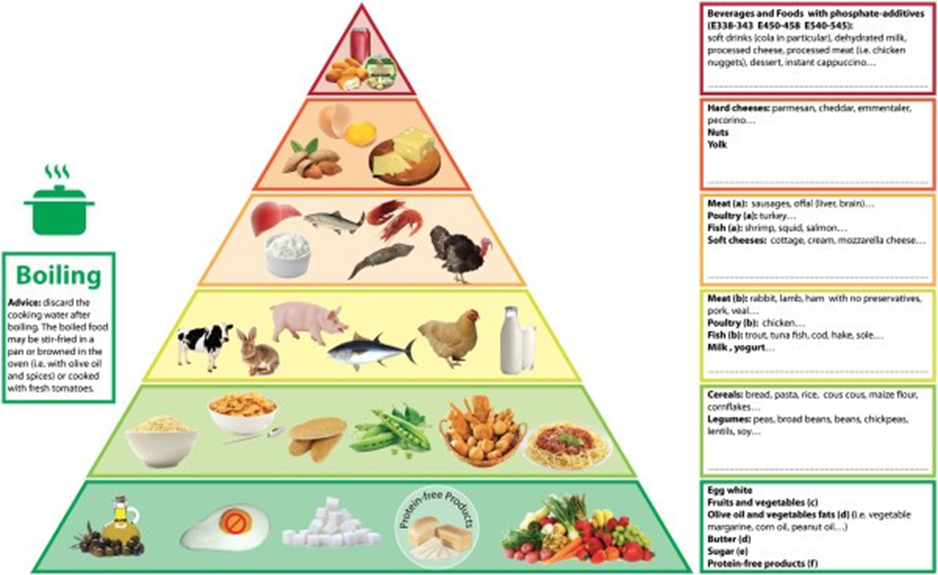
Figure - The phosphorus pyramid (D'Alessandro C, 2015)
Foods are distributed on six levels on the
basis of their phosphorus content, phosphorus to protein ratio and phosphorus
bioavailability. Each level has a colored edge (from green to red, through
yellow and orange) that corresponds to recommended consumption frequency, which
is the highest at the base (unrestricted intake) and the lowest at the top
(avoid as much as possible). a) foods with unfavorable phosphorus to protein
ratio (>12 mg/g); b) foods with favorable phosphorus to protein ratio (<12 mg/g);
c) fruits and vegetables must be used with caution in dialysis patients to
avoid excessive potassium load; d) Fats must be limited in overweight/obese
patients, to avoid excessive energy intake; e) sugar must be avoided in
diabetic or obese patients; f) protein-free products are dedicated to patients
not on dialysis therapy and who need protein restriction but a high energy
intake.
You
can learn more about the phosphorus pyramid by following the link
- https://bmcnephrol.biomedcentral.com/articles/10.1186/1471-2369-16-9.
Thus, in patients with CKD receiving dialysis, the daily phosphorus intake is up to 1000 mg. In the diet, it is recommended to take foods with sufficient levels of protein and reduced levels of phosphorus. It is recommended to keep PHOSPHORUS-TO-PROTEIN RATIO less than 12 mg/g.
Nutritional counseling sessions should evolve from the simple concept of phosphate restriction to оpportunities of educating the patient on differentiation between organic and inorganic sources of phosphate and avoidance of phosphate additives.
Bibliography:
Phosphorus bioaccessibility
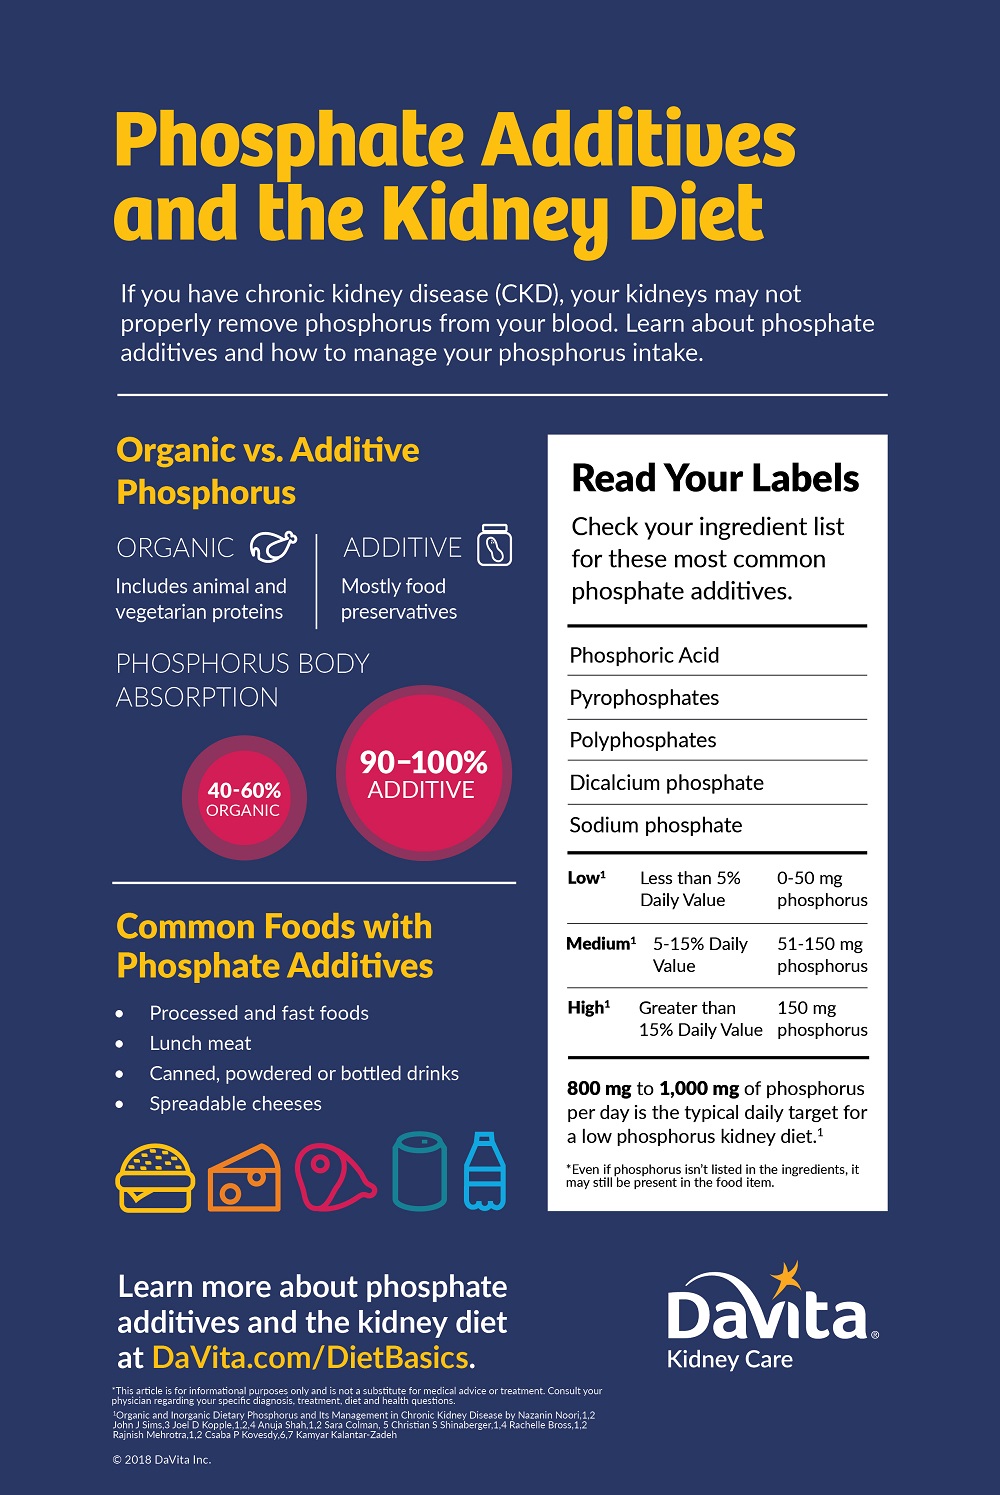
Organic phosphorus: Organic phosphorus is bound to carbon-containing molecules. This type of phosphorus is present both in animal and plant-based foods but differ considerably in the form. In general, organic phosphorus from animal foods are about 40-60% bioavailable. In plants, phosphorus is mainly present in nuts, seeds, beans, legumes and grains, and fruits and vegetables contain only small amounts of phosphorus. Unlike animal-based phosphorus, phosphorus in plants foods is mostlyfound in the form of phytic acid or phytate. Generally, plant-based phosphorus is thought to be less bioavailable than animal-based phosphorus (20-40% bioavailability).
Inorganic phosphorus: In contrast to organic phosphorus, inorganic phosphorus is found as free phosphate. Although inorganic phosphorus occurs naturally in food, the major source in the diet is from food additives that are used in a wide range of processed foods. Phosphorus additives serve a variety of useful functions in processed foods such as increasing shelf life, enhancing color and flavor, emulsifying, and acid-base buffering to name a few. Some common sources of phosphorus-containing food additives include dark colas, enhanced meats, frozen meals, cereals, snack bars, processed or spreadable cheeses, instant food products, and refrigerated bakery products. Generally, inorganic phosphorus has higher bioavailability (70%-100% bioavailability) as compared to organic phosphorus present in natural foods, though the exact bioavailability is controversial. Because phosphorus from food additives has higher bioavailability, the contribution of phosphorus from food additives is disproportionately higher than phosphorus naturally present in foods (Figure) (Dr. David St-Jules).

Bibliography:
Phosphatemic Index
Another recently studied concept is the phosphatemic index (PI). Similar to the glycemic index, the phosphatemic index measures the effect that foods and meals have on blood phosphorus levels, reflecting phosphorus bioavailability. Milk and dairy products had high PI values, pork and ham had medium PI values, and soy and tofu had low PI values. However, the phosphatemic index, like the glycemic index, does not account for differences in phosphorus per serving or relative to energy, nor the underlying severity of CKD-MBD. Future studies should assess the phosphatemic index, and potentially the phosphatemic load, in individuals with CKD to determine if it is a useful educational or research tool.
Bibliography:
Culinary Techniques for Reducing Phosphorus
Cooking and processing methods can also influence both the amount and bioaccessibility of phosphorus in foods. For example, soaking has been shown to reduce the amount of phosphorus in foods including legumes, vegetables, cereals, and grains, as well as some animal-based foods (D.B. Vahia de Abreu et.al). Wet-cooking methods and slicing meat have been shown to reduce phosphorus while maintaining protein content (S. Ando et.al.).
However, in addition to the quantity of phosphorus present, processing techniques can also influence phosphorus bioaccessibility. In plants, especially cereals and grains, legumes, seeds, and nuts, phosphorus comes largely from phytate. Phytate is mostly indigestible due to the lack of phytase in the small intestine of humans and has limited accessibility due to its likelihood to chelate with other minerals. Processing techniques such as treatment with phytase, soaking, boiling (>140°C) for prolonged periods of time, fermenting, or germinating may increase the release of phosphorus from phytate and increase the proportion of phosphorus containing compounds less likely to chelate, potentially making the remaining phosphorus more bioaccessible for absorption (U. Schlemmer, E. Morris et.al).
While culinary techniques including food processing are a potential tool to lower the phosphorus load from the diet, there are sparse data in this area, particularly as it relates to phosphorus bioavailability. Some culinary methods may both lower the overall quantity and increase the accessibility of phosphorus.
Bibliography:
Limiting the use of phosphorus-containing additives
Phosphorus is the main component of many preservatives and additive salts found in processed foods. When an artificial source of phosphorus is eaten, the body absorbs 90-100% of what’s eaten! Additives are used in food processing for a variety of reasons such as to extend shelf life, improve color, enhance flavor, and retain moisture. Common sources of inorganic phosphorus include certain beverages, enhanced or restructured meats, frozen meals, cereals, snack bars, processed or spreadable cheeses, instant products, and refrigerated bakery products. Fast food places and many restaurants also serve foods that contain inorganic phosphorus.
Table lists some of the most widely used additives containing phosphorus and the corresponding initials in the European Union countries.
Table 8. P-containing preservatives most commonly used in the trade and food industry (Cupisti A et al.)
Initials | Full Name | Food |
|---|---|---|
E 338 | Phosphoric acid | Cola and similar; fruit-flavoured soft drinks; jellies |
E 339a | Sodium dihydrogen orthophosphate | Candid fruit; soft drinks |
E 339b | Disodium hydrogen orthophosphate | Processed fruit products |
E 339c | Trisodium orthophosphate | Partly dehydrated milk containing at least 28% of dry matter |
E 340a | Potassium orthophosphate | Partly dehydrated milk containing more than 28% of dry matter |
E 340b | Dipotassium hydrogen orthophosphate | Dehydrated milk and skimmed milk |
E 340c | Tripotassium orthophosphate | Dehydrated milk and skimmed milk |
E 341a | Calcium tetrahydrogen diorthophosphate | Soft drinks, cola in particular; jellies |
E 341b | Calcium hydrogen orthophosphate | Soft drinks, cola in particular; jellies |
E 341c | Tricalcium diorthophosphate | Soft drinks, cola in particular; jellies |
E 343 | Magnesium phosphate | Fresh cheese, except mozzarella cheese |
E 450 | Polyphosphates | Bread, matl, toasted barley, coffee, chocolate, processed cheese, ice cream and dessert, potato flour, cooked ham, canned meat, cooked sausages, breaded products |
E 540 | Calcium diphosphate | Baked products |
E 541 | Sodium aluminum phosphate | Dehydrated milk, processed egg products, various flours |
E 544 | Calcium polyphosphates | Sauces, soups and broth, infusions made with instant tea, chewing gum, alcoholic beverages except wine and beer, powdered sugar, frozen fillets of unprocessed fish, spreadable fats (except butter), beverages made from coffee for vending machines, flavours |
E 545 | Ammonium polyphosphate | Cocoa and products made with chocolate |
Table 9. Commonly used phosphorus additives used in the food industry, their
purposes and food sources (Dr. David St-Jules)
.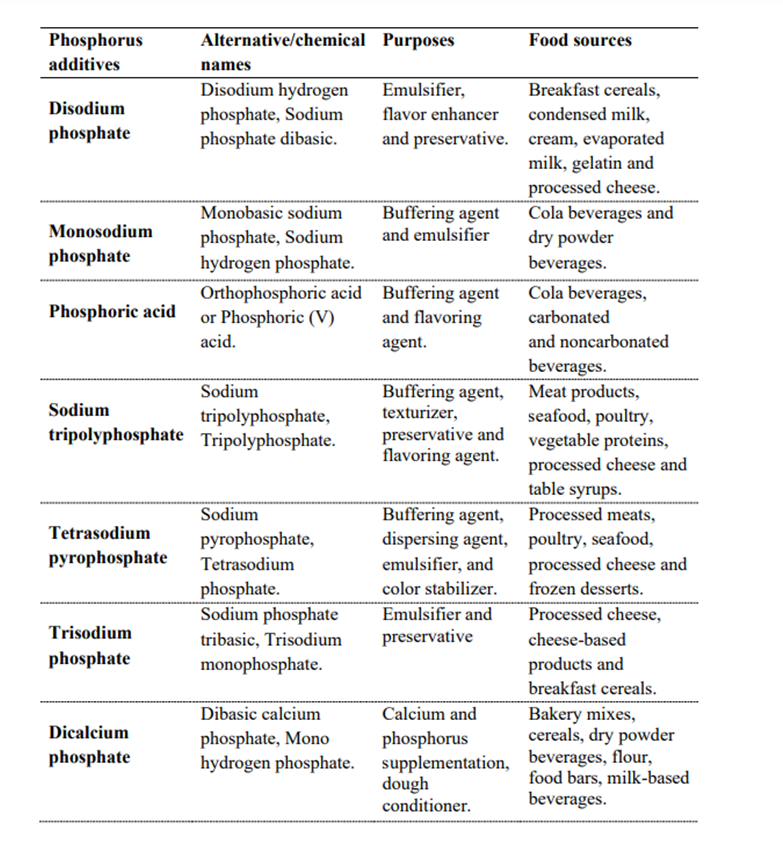
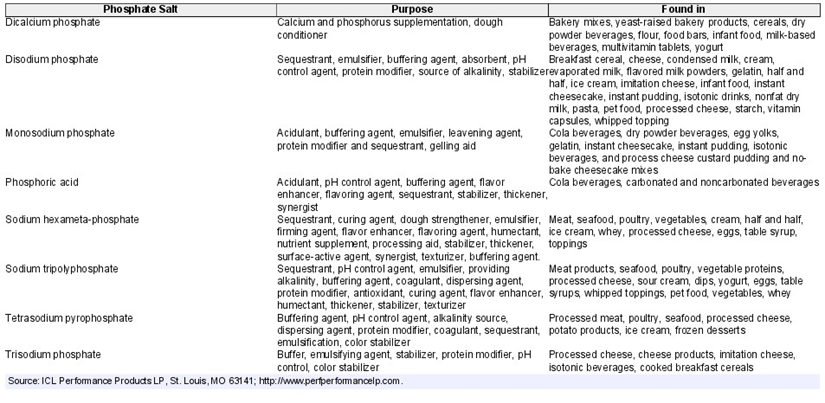
Table 10- Common phosphate additives used by food industry (Kalantar-Zadeh, 2010)
Most beverages contain little to no protein and, hence, any phosphate content is almost entirely from additives. As a consequence, patients who consume beverages with high phosphate content had serum phosphate levels that are often quite high whereas their nutritional status may be inferior. Additives can contribute more than 30% of the daily dietary phosphorus intake.
Patients should review food labels to limit intake of foods high in phosphorus. For exemple: Pork Chops (Lean). Pork Fresh Loin Sirloin (Chops) Bone-In Separable Lean Only Cooked Braised, serving saze 170 mg - 6 oz - https://tools.myfooddata.com/nutrition-facts/167838/wt9. 170 grams of this product contains 515 mg of phosphorus. This product contains high levels of phosphorus. 85 mg (3 oz) of this product contains 257 mg of phosphorus, which corresponds to 21% of the recommended intake -https://tools.myfooddata.com/nutrition-facts/167838/wt1/1. 100 grams of this product contains 303 mg of phosphorus or 24% of the recommended intake - https://tools.myfooddata.com/nutrition-facts/167838/100g/1.200 kilocalories (103 g) of this product contain 311 mg of phosphorus - 25% of the recommended intake - https://tools.myfooddata.com/nutrition-facts/167838/200cals/1.
Thus, knowing the level of phosphorus, a patient with CKD stage 5 can select foods with low levels of phosphorus.
Patient education is important: creating websites with information, brochures, manuals, infographics.
Examples are given below
Conclusion
Dietary intake of P is derived largely from foods with high protein content or food additives and is an important determinant of P balance in patients who have CKD and have a greatly reduced GFR. PO4 additives can dramatically increase the amount of P consumed in the daily diet, especially because P is more readily absorbed in its inorganic form. In contrast, plant foods, including seeds and legumes that are high in P, are usually associated with the least intestinal P absorption because of the phytate in these foods. Hence, the P burden from food additives in fast foods, soft drinks, and processed cheese and snacks is disproportionately high relative to its dietary P content compared with natural P sources from animal and plant protein. In patients with CKD, a mixed composition of dietary animal and plant foods that are rich in phytic acid should be encouraged, whereas the intake of processed foods should be limited. The increased use of P additives in food, coupled with the increased popularity of convenience foods and frequenting of fast food restaurants, has greatly increased the amount of P consumed by both the general population and patients with CKD. Meals that have lower amounts of organic and particularly inorganic P and are rich in high-value protein, along with P binders, can be provided during long hemodialysis treatment sessions to patients with CKD within inside dialysis clinics and monitored in-center by renal dietitians and nephrologists.
Bibliography:
8. Sourse
- Goyal R, Jialal I. Hyperphosphatemia. [Updated 2023 Jun 12]. In: StatPearls [Internet]. Treasure Island (FL): StatPearls Publishing; 2023 Jan-. Available from: https://www.ncbi.nlm.nih.gov/books/NBK551586.
- Richard J. Johnson & John Feehally & Jurgen Floege & Marcello Tonelli. Comprehensive Clinical Nephrology. Elsevier, Edinburgh, 2019
- US-DOPPS Practice Monitor. May 2021: https;//www.dops.org/DPM
- Pereira RA, Ramos CI, Teixeira RR, Muniz GAS, Claudino G, Cuppari L. Diet in Chronic Kidney Disease: an integrated approach to nutritional therapy. Rev Assoc Med Bras (1992). 2020 Jan 13;66Suppl 1(Suppl 1):s59-s67. doi: 10.1590/1806-9282.66.S1.59. PMID: 31939537.